This post is courtesy of Displayr who have generously offered to sponsor a series of independently authored posts about interactive visualization with R and JavaScript. Thank you so much Displayr for this opportunity.crossposted at buildingwidgets and Medium
d3 provides a helpful suite of layouts (cluster, tree, treemap, pack, and partition) for visualizing tree networks or hierarchies. In addition, we have the d3-sankey plugin for a Sankey diagram as another mechanism for presenting tree data. Approaching the layout decision as a mutually exclusive proposition means that we lose many of the benefits from alternative layouts. However, incorporating our favorite features from more than one layout can provide us with a more effective means of interactive visualization of the very common tree data structure. Let’s explore the specific combination of d3.tree() with d3-sankey.
d3.tree()
In 1981 Edward Reingold and John Tilford published
Reingold, Edward M., and John S. Tilford. “Tidier drawings of trees.” IEEE Transactions on Software Engineering 2 (1981): 223–228.
which gives us the Reingold-Tilford algorithm, the basis of d3.tree(). Here is a quick unadorned example of the output of d3.tree() with the R dataset Titanic using networkD3 diagonalNetwork() for convenience.
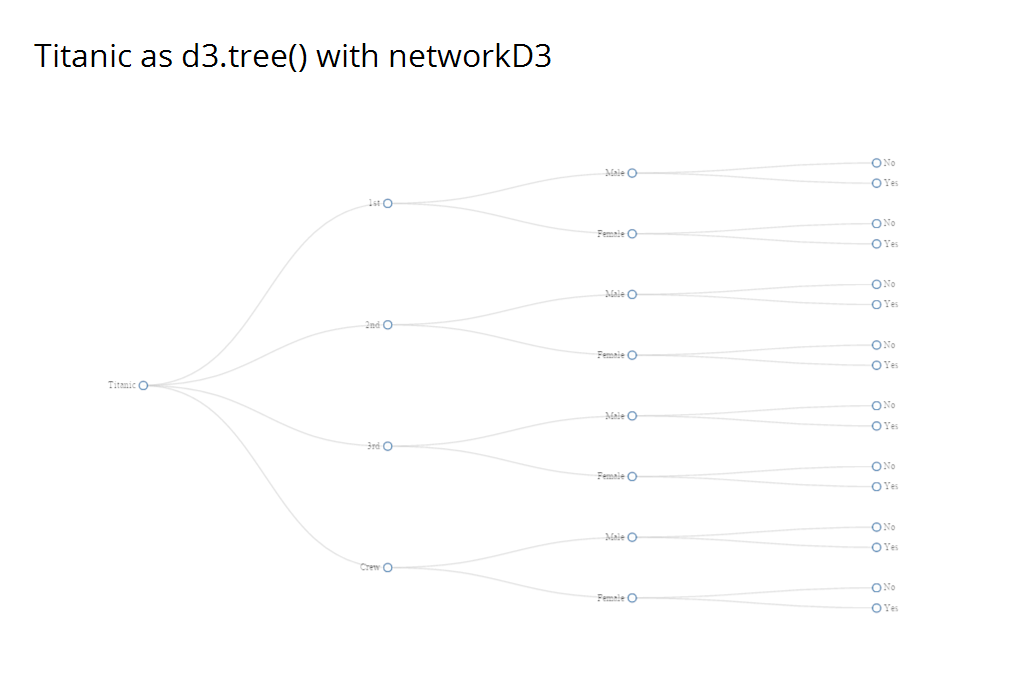
If we look closely, we can see two potential shortcomings. All nodes are assumed to be the same size, and the links do not reveal size.
d3-sankey
In contrast, d3-sankey helps overcome the two shortcomings of d3.tree() mentioned above. In the next example, we use the same data in a Sankey diagram. We can see that node sizes are no longer uniform and links reveal size.
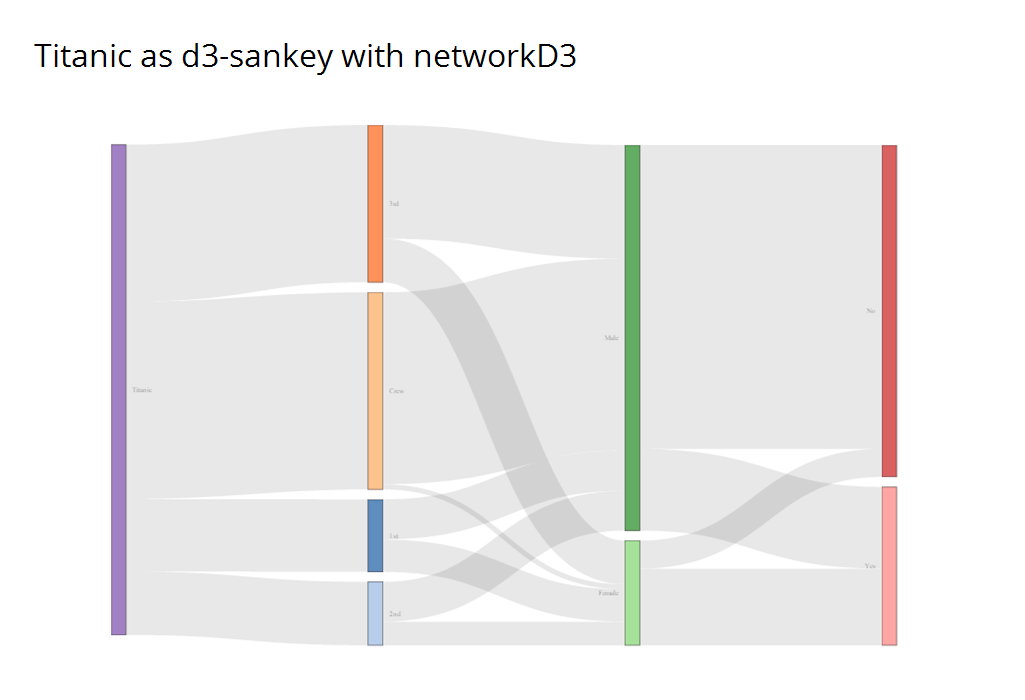
So we “solved” the d3.tree() shortcomings, but when we represent as a Sankey diagram, I think we lose the fact that the underlying data is a tree. This “loss of insight” becomes more obvious when we try to think of ways to collapse a Sankey diagram.
sankeytree
Let’s explore how we might blend d3-sankey with d3.tree() and call our concoction a sankeytree. We can start with d3.tree() and then draw our nodes and links to be Sankey-like with height proportional to size. Displayr has helped us here with their open source R htmlwidget rhtmlSankeyTree. Below is an example.
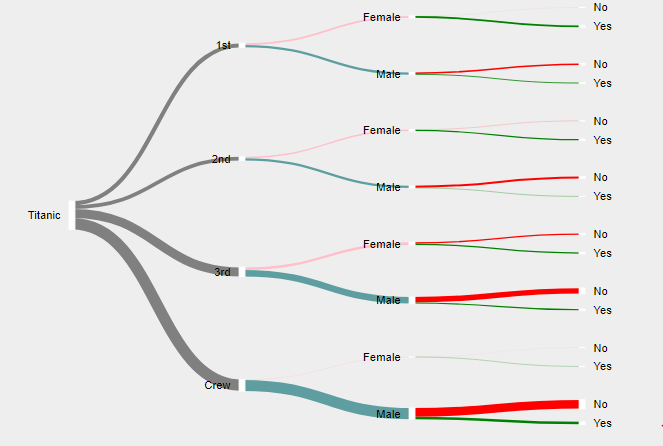
While not perfect, the height of the flow from parent to child now indicates size of the child in relation to size of the parent. This combined layout still suffers from the constant node height constraint of the Reingold-Tilford algorithm in d3.tree() and is much less compact than d3-sankey. However, with pan, zoom, collapse, and expand interactivity, we can help overcome the loss of compactness from wasted space. This interactivity also aids user intuition around the tree structure. Here is an example.
Using sankeytree with Recursive Partitioning
Decision tree learning results in tree structures that offer a more “real-life” opportunity for sankeytree. We can quickly explore a very basic recursive partitioning classification on the Titanic data that we have used throughout the post. To do it with no coding, we’ll use Displayr (live example).
Next Steps
Interactivity improves the experience and intuition with sankeytree, but the wasted space bothers me. In future posts in the series, we will explore more combinations of sankey features with d3 layouts and extensions to eliminate the wasted space and improve the user experience.