This post is courtesy of Displayr who have generously offered to sponsor a series of independently authored posts about interactive visualization with R and JavaScript. Thank you so much Displayr for this opportunity.crossposted at buildingwidgets and Medium
This will be the last post in our iterations in visualizing trees. In the next post, we’ll move on to how we can use the very popular React in R.
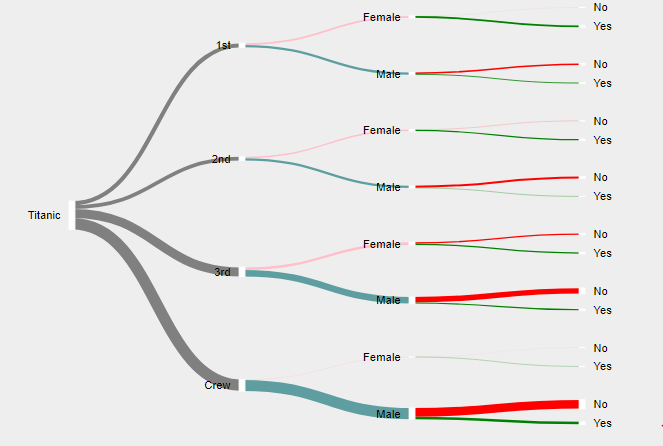
Our first post yielded a sankeytree concoction.
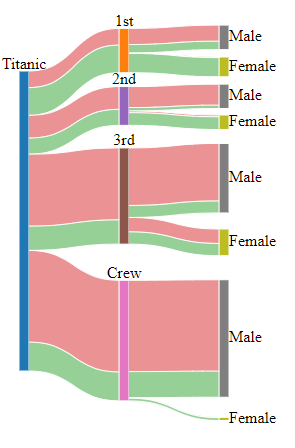
Then our second post made a more compact parttree.
Although the parttree is more compact, we can compress even further by stacking our link paths to reflect the leaf details and eliminating the leaf nodes. Then, we can blend in some interactivity to help the user process the visualization and examine the data.
Eliminating Repetition
At the leaf level of our parttree, the repetition of "Yes" and "No" could interfere with our ability to compare survival at each level.
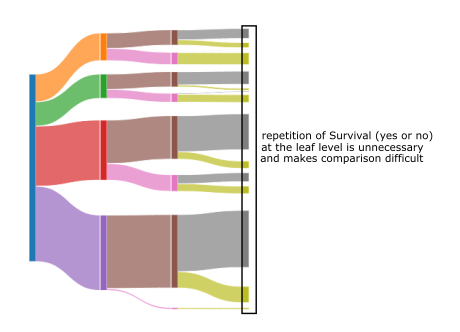
Let’s see what happens if we instead convey the survival information in our link paths that connect the nodes. This is similar to a stacked bar or streamgraph. To accomplish this, we will use d3.stack().
Interactivity
We save some space, but a user might get confused. For example, the "Yes" does not flow through the nodes. Some interactivity might help clear up the confusion.
Next
Iterating through our last three posts demonstrates how creative blending can result in unique representations of tree hierarchies from R or JavaScript. We’ll stop here with our iteration, but we could easily transform this or other visualizations into htmlwidgets for even easier consumption by R users.
Much of the recent innovation in JavaScript visualization has happened in the newest frameworks, such as React and Vue. We’ll see in the next couple of posts how to use these new frameworks in R.