This post is courtesy of Displayr who have generously offered to sponsor a series of independently authored posts about interactive visualization with R and JavaScript. Thank you so much Displayr for this opportunity.crossposted at buildingwidgets and Medium
In this post, we will pivot from iterative tree visualization to using the very popular JavaScript thing called React in R. With some assistance from the helper R package reactR, we will learn to incorporate React components in our output and make a Semiotic chart from R data. I would recommend reading and working through the React tutorial before beginning this post, but I bet you can follow along even if you ignore this recommendation.
reactR
Most React projects require at least two things:
ReactandReactDOMJavaScript dependenciesbabelcompiler to convertJSXand/or ES2015 (and beyond) to plain old JavaScript.
To ease this burden for the R user of React, I built the package reactR which allows us to accomplish both of the above requirements. reactR::html_dependency_react() provides up-to-date JavaScript dependencies for React and ReactDOM for use in Rmarkdown, Shiny, or other html projects. reactR::babel_transform() uses the V8 package to compile your JSX and ES2015 (and beyond) all within your R session.
Pattern for React and R
We will use the following generic pattern as we attempt to combine React with R.
library(htmltools)
library(reactR)

tagList(
  # add JavaScript dependencies React and ReactDOM
  reactR::html_dependency_react(),
  tags$div(...),
  tags$script(HTML(
    # babel_transform is only necessary if we plan to use
    #   ES2015 and/or JSX.  Most of the React examples out
    #   there will use one or both.
    reactR::babel_transform(
      sprintf(...)
    )
  ))
)
First Example
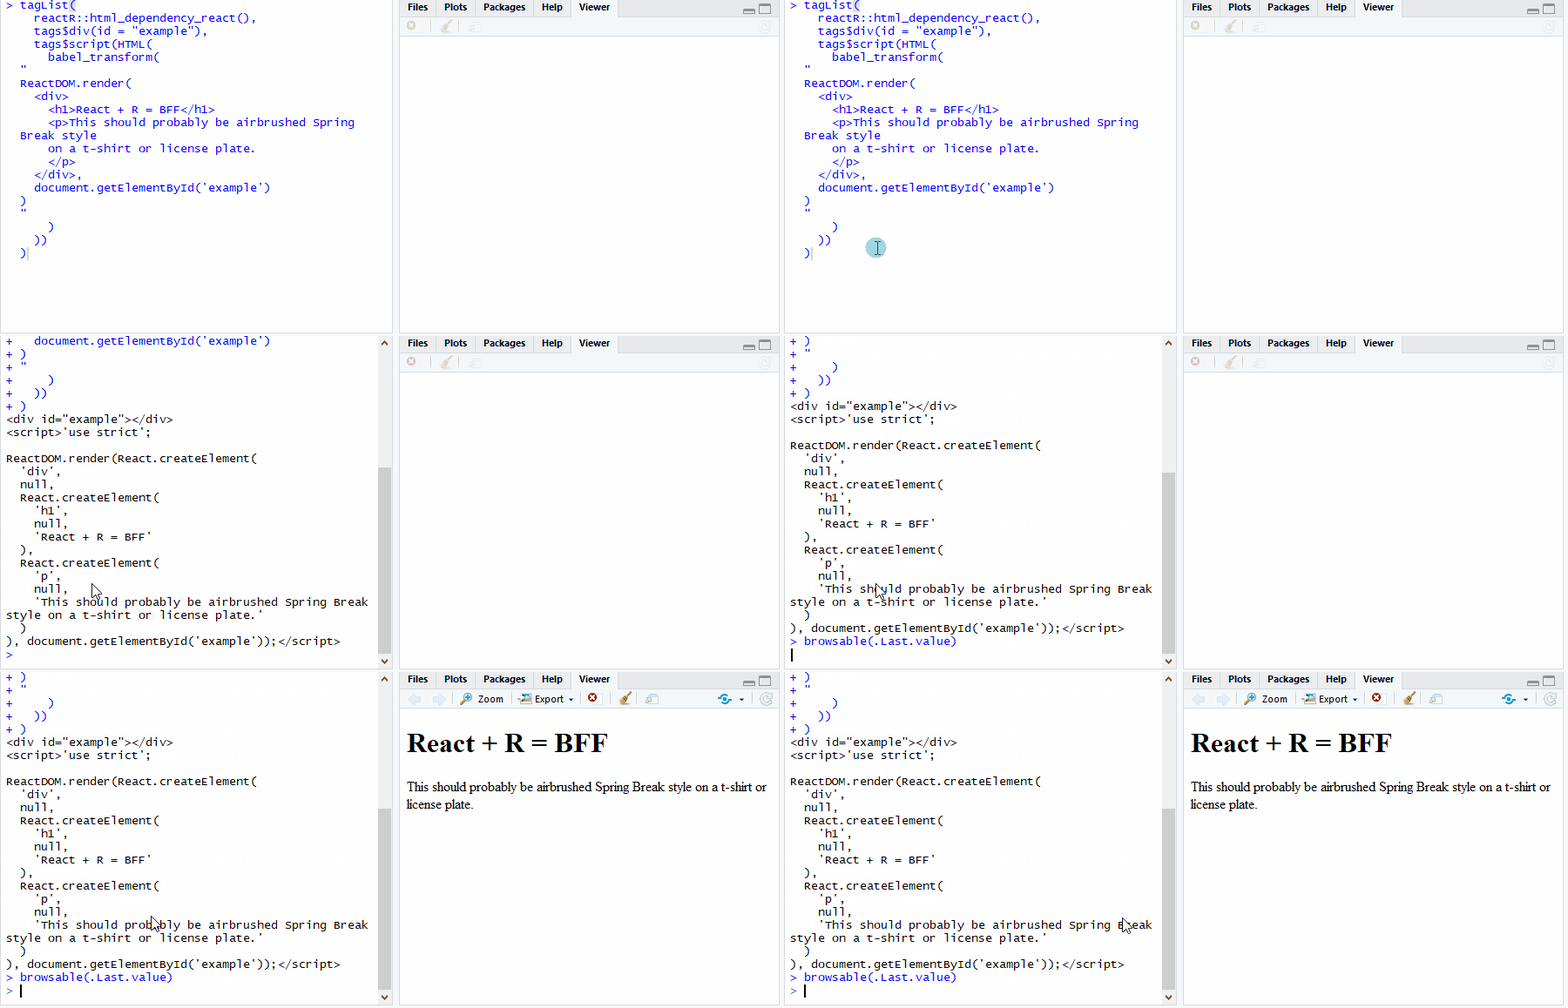
Let’s try it with a real example similar to the React Hello World! example. In our example, we will use React to render a heading h1 along with some text.
library(htmltools)
library(reactR)

tagList(
  reactR::html_dependency_react(),
  tags$div(id = "example"),
  tags$script(HTML(
    babel_transform(
"
ReactDOM.render(
  <div>
    <h1>React + R = BFF</h1>
    <p>This should probably be airbrushed Spring Break style
    on a t-shirt or license plate.
    </p>
  </div>,
  document.getElementById('example')
)
"
    )
  ))
)

Often, quotes " and ' are the most frustrating part about combining JavaScript and R. I tend to use " for R and ' for JavaScript.
Office React Components in R
I know that most R purists have eliminated Microsoft Office from their workflows, but we can bring a little bit of the “good” from Microsoft Office with the very well-built and helpful Office UI Fabric components for React. And yes you can use these with Shiny.
library(htmltools)
library(reactR)

fabric <- htmlDependency(
  name = "office-fabric-ui-react",
  version = "5.23.0",
  src = c(href="https://unpkg.com/office-ui-fabric-react/dist"),
  script = "office-ui-fabric-react.js",
  stylesheet = "css/fabric.min.css"
)

browsable(
  tagList(
    html_dependency_react(offline=FALSE),
    fabric,
    tags$div(id="pivot-example"),
    tags$script(HTML(babel_transform(
"
class PivotBasicExample extends React.Component {
  render() {
    return (
      <div>
        <Fabric.Pivot>
          <Fabric.PivotItem linkText='My Files'>
            <Fabric.Label>Pivot #1</Fabric.Label>
          </Fabric.PivotItem>
          <Fabric.PivotItem linkText='Recent'>
            <Fabric.Label>Pivot #2</Fabric.Label>
          </Fabric.PivotItem>
          <Fabric.PivotItem linkText='Shared with me'>
            <Fabric.Label>Pivot #3</Fabric.Label>
          </Fabric.PivotItem>
        </Fabric.Pivot>
      </div>
    );
  }
}
ReactDOM.render(<PivotBasicExample />, document.querySelector('#pivot-example'));
"
    )))
  )
)
Now you might have noticed that the RStudio Viewer showed up as blank. This seems to be an issue with non-local JavaScript dependencies in RStudio Viewer. I think the only way around this problem is to store the dependencies locally. A package housing these dependencies similar to reactR is probably the best option.
antd React Components to Step Through lm
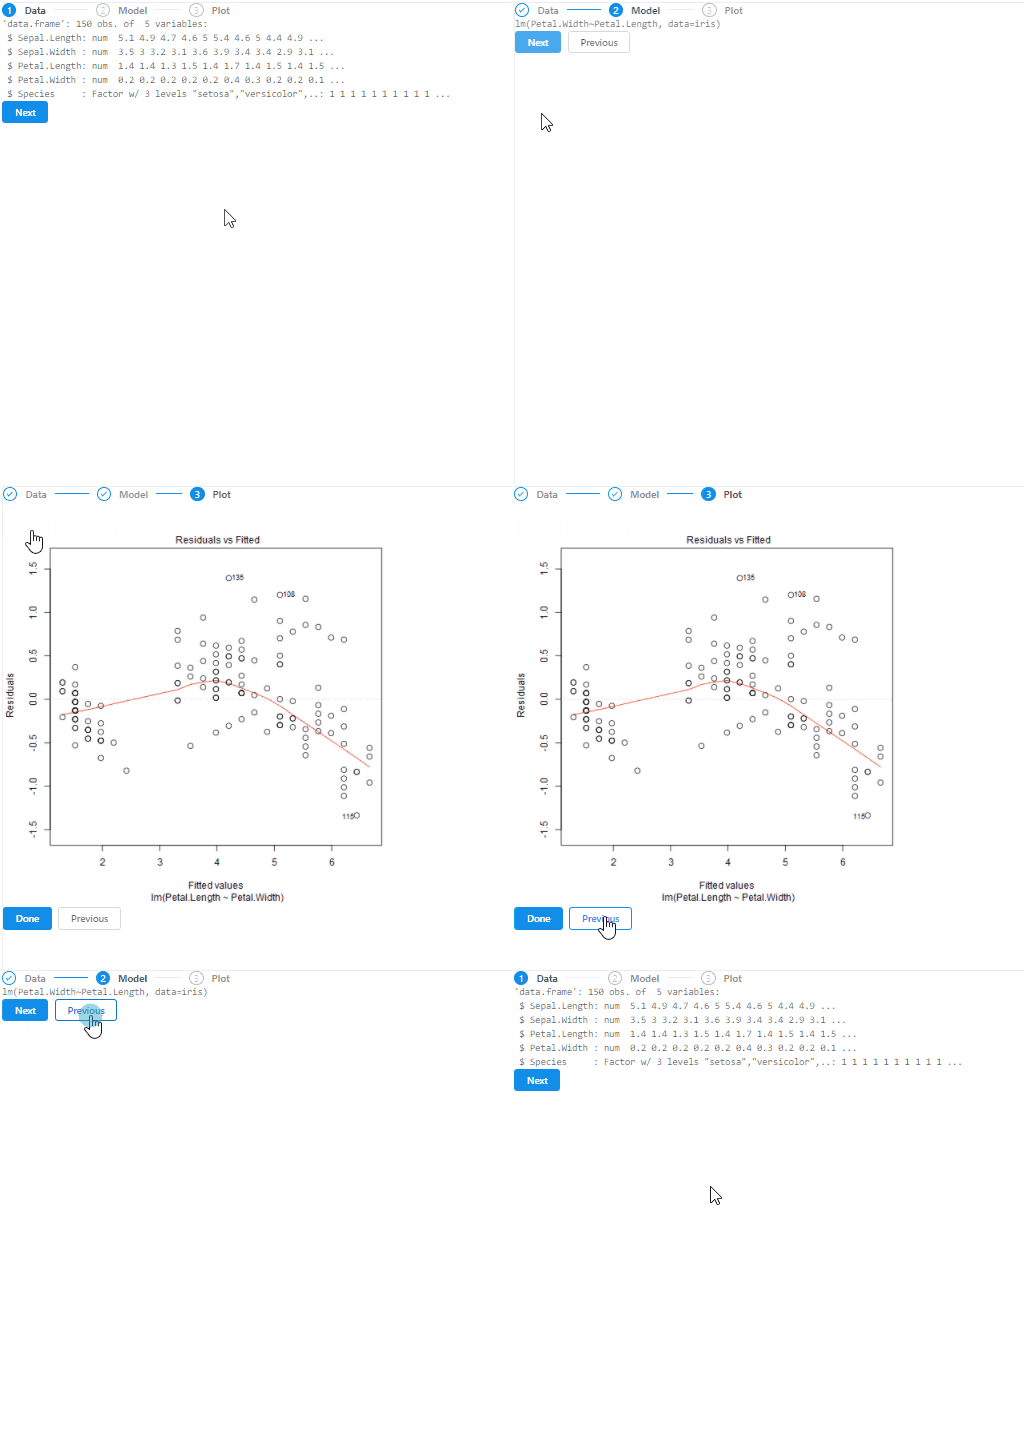
antd is another set of very nice React components. Let’s walk through a lm from R using the step-through antd component.
Now we are getting much closer to our ultimate objective of using R data with React with a synergistic result.
Visualizations with Semiotic
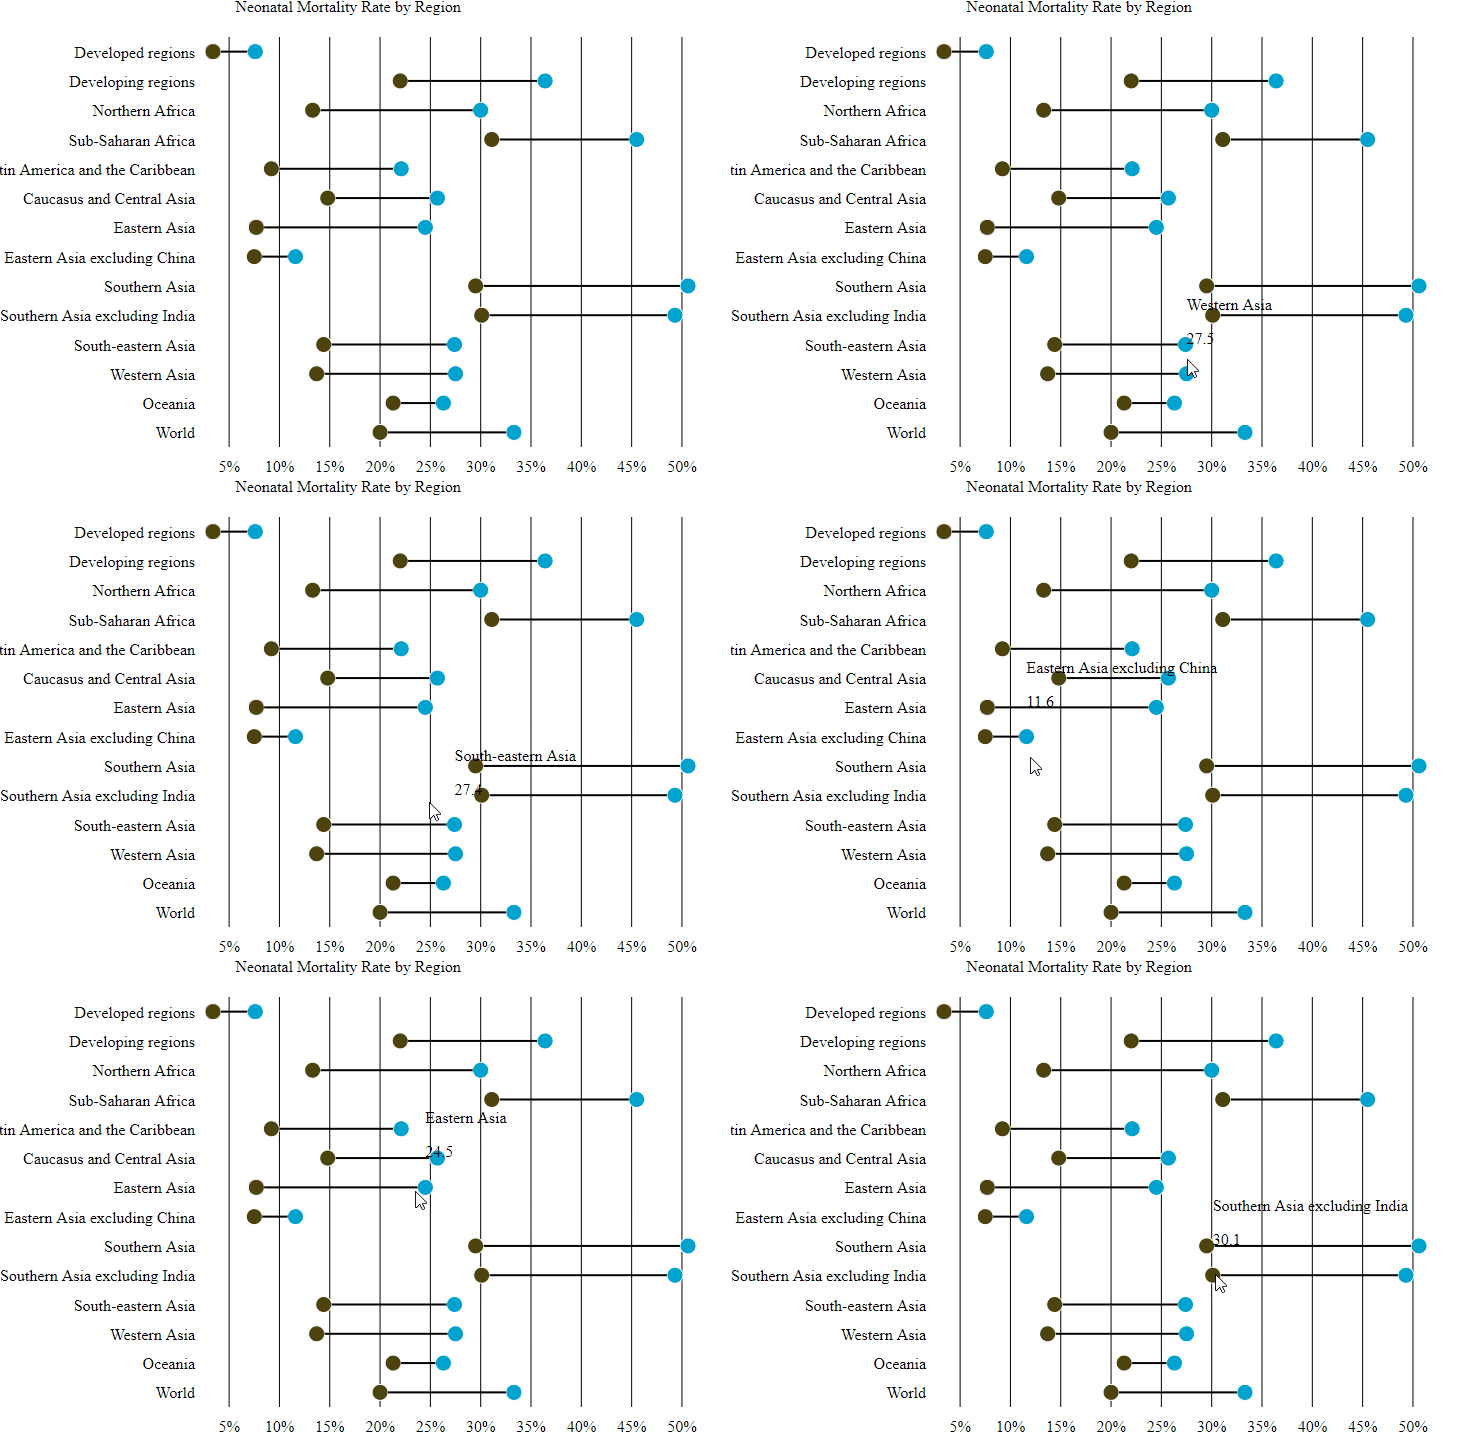
Elijah Meeks has very generously contributed the React-based visualization library Semiotic. We will recreate one of the examples, but we’ll do the data part in R. Data from R and interactive vis from JavaScript hopefully will continue to become a popular and common workflow.
An htmlwidget for Semiotic would offer the ideal method of full integration, but I have not yet determined a good pattern for creating React-based htmlwidgets. Please let me know if you have thoughts or would like to collaborate towards achieving this goal.
Next Steps
An obvious next step would be integrating React with Shiny, and as I said before, this is possible. Also, there is another very popular JavaScript framework called Vue that I actually think is even easier to integrate with R. In the next post, we’ll demonstrate R + Vue.


